
- 343
- 5 619 676
MITutorials
Приєднався 20 кві 2014
Welcome to MiTutorials!
Are you ready to become an expert in Power BI and Excel? You’re in the right place! Our channel is dedicated to helping you master these powerful tools and make your daily tasks easier. Whether you’re stuck on a complex problem at work or looking to enhance your data skills, we’ve got you covered.
What You’ll Find Here:
1. In-Depth Tutorials: Step-by-step guides to help you learn and master Power BI and Excel.
2. Tips & Tricks: Quick tips to boost your productivity and efficiency.
3. Real-World Solutions: Practical examples and solutions to common workplace challenges.
4. Weekly Updates: Fresh content to keep you up to date with the latest features and best practices.
Connect with Us:
Have questions or need help with a specific topic? Don’t hesitate to reach out! Leave a comment on our videos or connect with us on mitutorials08@outlook.com
Subscribe now and start your journey to becoming a Power BI and Excel expert!
Filter Power BI Reports Using URL | Query String Parameters | Dynamic URL | MiTutorials
Learn how to efficiently filter your Power BI reports using URL parameters! In this tutorial, we'll guide you through the process of adding and customizing URL filters to dynamically control the data displayed in your reports. Whether you're embedding reports or sharing filtered views, this powerful technique will enhance your data analysis and presentation capabilities. Don't forget to like, share, and subscribe for more Power BI tips and tricks
Download Dataset : 1drv.ms/f/s!ArKvq35SpC2G7FUHo0mtc4c4XuGd?e=MDh0dN
For Queries ✉ : MiTutorials08@outlook.com
Download Dataset : 1drv.ms/f/s!ArKvq35SpC2G7FUHo0mtc4c4XuGd?e=MDh0dN
For Queries ✉ : MiTutorials08@outlook.com
Переглядів: 383
Відео


Power BI's Game-Changing New Report Format | PBIR | MiTutorials
Переглядів 1,1 тис.День тому
Discover the groundbreaking Power BI Enhanced Report Format (PBIR) that’s revolutionizing enterprise BI development. In this tutorial, we’ll walk you through how PBIR enhances team collaboration, improves development efficiency, and integrates seamlessly with source control systems. Learn how to enable PBIR, save your projects, and leverage its powerful features for consistent and efficient rep...
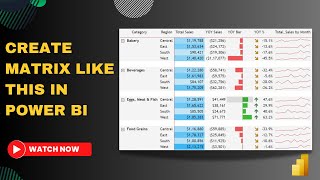
Transform Boring Matrix into Beautiful Visual in Power BI | Easy Tips & Tricks | MiTutorials
Переглядів 2,2 тис.21 день тому
In this tutorial, I'll show you how to turn your plain and boring matrices into stunning visualizations that are both beautiful and easy to understand. Whether you're working on a school project, a professional report, or just love making data look amazing, these tips and tricks will help you take your matrix game to the next level. 🔹 What You'll Learn: Color-coding techniques Conditional forma...

Power BI Many-to-Many Relationships: Issues and Fixes Explained | MiTutorials
Переглядів 693Місяць тому
Are you struggling with many-to-many relationships in Power BI? In this tutorial, we delve into the common issues caused by many-to-many relationships and show you effective ways to fix them. Learn how to use bridge tables and DAX functions to streamline your data model and ensure accurate reporting. 🔹 Topics Covered: Understanding many-to-many relationships Issues caused by many-to-many relati...

Power BI May 2024 Update: New Matrix Layouts, Line Enhancements & Manage Relationships | MiTutorials
Переглядів 2,6 тис.Місяць тому
In this tutorial, we explore the exciting new features introduced in the Power BI May 2024 update! Discover the enhanced Matrix Layouts inspired by Excel's PivotTable, allowing for compact, outline, or tabular layouts. Learn how to create custom layout patterns, insert blank rows, and improve report readability. Next, delve into the latest line enhancements that give you unprecedented control o...

Step by Step Tutorial to Create Gantt Chart in Power BI using Deneb | MiTutorials
Переглядів 1,9 тис.Місяць тому
Welcome to our comprehensive tutorial on creating a dynamic Gantt Chart using the Deneb Visual in Power BI! Whether you're new to Gantt charts or looking to enhance your project management toolkit, this video is for you. In this tutorial, we will cover: What is a Gantt Chart? Learn the basics and understand its importance in project management. Full Feature Breakdown: Explore the powerful featu...

No Primary Key in your table? 3 Essential Methods Without a Primary Key in Power BI | MiTutorials
Переглядів 460Місяць тому
Unlock the secrets of database management with our latest tutorial! In this video, we dive deep into the world of database keys, exploring three essential methods for handling tables when a primary key is nowhere to be found. From merge queries to composite keys and surrogate keys, we've got you covered! Whether you're a seasoned data wrangler or just starting out, this tutorial will equip you ...

Embedding Images Without URL | Base64 Encoding Method in Power BI | MiTutorials
Переглядів 8552 місяці тому
Unable to Display/Embed Images from Sharepoint / One Drive or Any URL ? In this Power BI tutorial, learn how to embed images directly into your reports without relying on external URLs. Discover the Base64 encoding method, a workaround for the limitations posed by URL accessibility in Power BI. Whether you're a beginner or an advanced user, this tutorial will guide you through the process step ...

Take Your Bar Charts to Next Level | IBCS Style Variance Chart in Power BI | MiTutorials
Переглядів 9632 місяці тому
📊 Ready to revolutionize your data visualization in Power BI? In this tutorial, we'll introduce you to the powerful world of IBCS Style Variance Charts, designed to provide clear and concise comparisons between previous year sales data. Watch as we transform ordinary bar charts into dynamic visualizations that not only showcase your data but also provide actionable insights. Download Dataset : ...
How to use Field Parameters with Custom Data Labels in Power BI | MiTutorials
Переглядів 9393 місяці тому
Unlock the full potential of your charts with custom data labels! In this tutorial, we dive deep into utilizing field parameters to create personalized data labels that stand out. While the feature may not work directly, we've got you covered with a clever workaround that will elevate your data visualization game. Join us as we explore innovative techniques to make your charts pop and communica...
Unable to Fix Date Format in Power BI or Excel ? Watch this | Text-to-Date Conversion | MiTutorials
Переглядів 2 тис.3 місяці тому
Unlock the full potential of Power Query in Excel and Power BI with our comprehensive tutorial on date formatting and text-to-date conversion! In this step-by-step guide, we'll walk you through the process of fixing date formats and seamlessly converting text columns to dates using Power Query. Whether you're a beginner or an experienced user, you'll gain invaluable insights into streamlining y...
How to Conditionally Update Columns in Power BI | ETL Process | M Code | MiTutorials
Переглядів 8324 місяці тому
🔍 Dive into the world of Power BI ETL processes and discover how to handle null values in your dataset using Simple M code! In this comprehensive tutorial, we'll guide you through step-by-step instructions on conditionally updating columns, ensuring your data is clean, accurate, and ready for powerful analysis. 💼✨ Key Highlights: 🔹 Understand the significance of ETL (Extract, Transform, Load) i...
🚀 NEW FEATURE : Magic of Visual Calculations in Power BI | MiTutorials
Переглядів 4,5 тис.4 місяці тому
🚀 Dive into the future of data analytics with our in-depth Power BI tutorial on Visual Calculations! Say goodbye to complex DAX headaches and hello to a seamless Excel-like experience within Power BI. Join us as we unlock the secrets to effortlessly building powerful formulas and supercharging your data insights. Whether you're a data pro or just starting, this tutorial is your ticket to becomi...
Show Both Selected & Deselected Slicer Values on the same page in Power BI | MiTutorials
Переглядів 1,1 тис.4 місяці тому
Discover the secrets to showcasing both selected and deselected values simultaneously on your Power BI reports. 👍 Don't Forget to Like and Subscribe: If you find value in this tutorial, give it a thumbs up, subscribe to our channel, and hit the notification bell. Stay tuned for more Power BI insights! 📝 Have Questions or Suggestions? Drop them in the comments below. Your feedback is invaluable!...
Mastering DAX Variables: Boost Your Power BI Formulas | MiTutorials
Переглядів 1,5 тис.5 місяців тому
Mastering DAX Variables: Boost Your Power BI Formulas | MiTutorials
Read Email Attachments Directly from Power BI | Automate your Weekly/Monthly Reports | MiTutorials
Переглядів 3,3 тис.5 місяців тому
Read Email Attachments Directly from Power BI | Automate your Weekly/Monthly Reports | MiTutorials
10 Best Practices in Power Query every developer must know | MiTutorials
Переглядів 2,5 тис.6 місяців тому
10 Best Practices in Power Query every developer must know | MiTutorials
How to Create Shaded Areas Between lines in a Line Chart in Power BI | MiTutorials
Переглядів 1,7 тис.6 місяців тому
How to Create Shaded Areas Between lines in a Line Chart in Power BI | MiTutorials
🚀NEW! Supercharge Your Charts with Stunning Styling & Data Label Customization PowerBI | Mitutorials
Переглядів 1,3 тис.6 місяців тому
🚀NEW! Supercharge Your Charts with Stunning Styling & Data Label Customization PowerBI | Mitutorials
The Ultimate Date Picker visual from PowerViz for Power BI | MiTutorials
Переглядів 4,8 тис.6 місяців тому
The Ultimate Date Picker visual from PowerViz for Power BI | MiTutorials
Mastering Pareto Charts: Use the 80/20 Rule + Interactive Line Toggle | MiTutorials
Переглядів 8557 місяців тому
Mastering Pareto Charts: Use the 80/20 Rule Interactive Line Toggle | MiTutorials
🚀 NEW - Reference Labels in Power BI | Step by Step Tutorial | MiTutorials
Переглядів 6 тис.7 місяців тому
🚀 NEW - Reference Labels in Power BI | Step by Step Tutorial | MiTutorials
🚀 NEW DAX Query View in Power BI | Step by Step Tutorial | MiTutorials
Переглядів 3,9 тис.7 місяців тому
🚀 NEW DAX Query View in Power BI | Step by Step Tutorial | MiTutorials
🚀 NEW Button Slicer in Power BI is just WOW 🎯 | MiTutorials
Переглядів 14 тис.7 місяців тому
🚀 NEW Button Slicer in Power BI is just WOW 🎯 | MiTutorials
Power BI RANK and RANKX Functions explained with Real-world Examples | MiTutorials
Переглядів 4,5 тис.7 місяців тому
Power BI RANK and RANKX Functions explained with Real-world Examples | MiTutorials
Create Overlapping Charts for Enhanced Data Insights in Power BI using Native Visuals | MiTutorials
Переглядів 2,5 тис.8 місяців тому
Create Overlapping Charts for Enhanced Data Insights in Power BI using Native Visuals | MiTutorials
Create Custom Column Chart to display Years, months, YTD in Power BI | MiTutorials
Переглядів 4,7 тис.8 місяців тому
Create Custom Column Chart to display Years, months, YTD in Power BI | MiTutorials
NEW! Model Explorer and Calculations Groups in Power BI | MiTutorials
Переглядів 4,5 тис.8 місяців тому
NEW! Model Explorer and Calculations Groups in Power BI | MiTutorials
Create Unique looking Heatmap using Matrix visual in Power BI | MiTutorials
Переглядів 2,4 тис.8 місяців тому
Create Unique looking Heatmap using Matrix visual in Power BI | MiTutorials
Compare 2 Periods in a Unique way using Column Chart in Power BI | MiTutorials
Переглядів 3,8 тис.9 місяців тому
Compare 2 Periods in a Unique way using Column Chart in Power BI | MiTutorials
Thank you so much..!!
What about if the file is Excel, not csv?
Good explanation thanks for posting
@MITutorials, great tutorials as always. However I could not find the "Calendar" Table in your dataset can you please make it available? Thanks so much
Please make a video how to findout "product last purchase date with it;s current value"
Big help! Thank u!!
😢
Power BI - Help me please!!! I have a Power BI Column "Date" and I need discount 3 days from this specific date taking off Satuday, Sunday and holidays dates in a Holiday table. ----------------------------------------------------------------------------------------------------------------------------------------------------------------------------------------------------------- Example (discounted Saturday and Sunday): Date Column (discount days in formula) Result in a new Date Column 24/06/2024 -3 Days (networkdays) = 19/06/2024 (discounted Saturday and Monday) --> and if has holiday date discount holiday date too.
If i want 0 defailt columns, any idea how to do it? Currently we have to select atleast 1 column ftom slicer ekse all columns will be displayed
Can this exporting data with query can be done multiple time in same dashboard?
Yes! As different tables.
Exactly the one i was looking for. Thankyou so much.
This video helped me implement the Red/Green indicator in my Project. Thank you so much for this video. Your explanation is amazing.
Glad you found it helpful!
@@MITutorials Yes found it very helpful. Thank you 😊
Will this work even if we change the slicer?
Brilliant, really helped
This will not work for line chart only tables and matrix it is working
wonderful
HOW TO DO WITH EXCEL? LIKE I CREATED A FILE IN EXCEL CONTAINING SR.NO, ITEM_CODE, USER EMAIL,COMMENTS AND ADDED THAT IN SHAREPOINT AND CONNECTED TO POWERBI WHERE I DROPEED ITEM CODE FROM POWERBI BUT WHEN I TRY TO CALL IT IN THE EXCEL FORM IT DOESNT WORK.COULD YOU MAKE A VIDEO ON THIS?
how to apply for date range slicer.
I don't know, but I can't make the custom date slicer disappear when the other options are selected, although I added Disable Date Slicer as a filter to the visual. Is someone facing the same issue?
This still didi not work in the data i have, can i send the data to you to hvw VIEW?
Sure! Shoot me an email and I will look into it
Thanks For video, its very helpful.. However i have a variation i need help with. I have two scenarios.. Orderlines for one customer (who is a customer type - merchant) advised order despatch date is RequestedDate... Therefore calculation would be difference between DespatchDate - RequestedDate... However if (customer type - anything else), calculation would need to be DespatchDate - PromisedDate... How can i combine a IF statement??
Great, saved me a lot of time
Super 👌… does it also work for shared mailbox or is it only for our inbox?
After two days of trying to figure this out! Thank you brother!
it's very nice. it can be more helpfull if you explain the process how is it working so it's eary to remember. thanks keep it up. waiting for you new videos for this type. best of luck.
Microsoft needs to learn from you how to create a tutorial. Their tutorials are so fucking crap it is unbelievable.
Glad you found this helpful ! 😊
I like your video but when you used the slicer range data changed once you back the mtd the slicer was not disabled is it possible to create
Thank you
thank you so much good video 😇😇😇
Is this thing would work on google sheets too.
The way you teach, very hard to understand
Thank you ! small correction: default order of rankx ties is skip
Mine has an issue --> Cannot convert value 'January' of type Text to type Date. Please help
Thank you
This know everyone... there should be entire row highlighted in conditional formatting..
To export data, the limitation is 150,000 rows. Does this mean exporting data will be affected here since the table is pivoted?
Most searched video Thanq thanq .....
Thank you sir 😊
Nice one!
Thanks for sharing this video this help me a lot I have one question want to get the signs for Malesia regent and Sri Lanka but Power BI does not accept SWITCH( SELECTEDVALUE(Exchange_Tbl[Currency],"EUR"), "INR", "₹#,##0", "LKR", "Rs #,##0", "VND", "₫#,##0", "THB", "฿#,##0", "PKR", "₨#,##0", "MYR", "RM #,##0", "SGD", "$#,##0", "IDR", "Rp#,##0", "PGK", "K#,##0", "EUR", "€#,##0", "USD", "$#,##0", "AUD", "$#,##0", "NZD", "$#,##0", "" )
Hello, i have LY sales and CY Sales in seperate table. I want to show the YTD & MTD along with last years sales. How will i do it using this formula, i tried this but it’s giving me only the CY.
I love it ! Thank you
Can you please show me how we can start this graph from April onwards (fiscal year trend)? Specifically for this type of line graph.
Watch this How to Sort Months by Fiscal Months in PowerBI | MITutorials ua-cam.com/video/g-DICCoQt7g/v-deo.html
thanks bro..3-4 hrs se pareshan tha...
You explained very clearly, Thank you for sharing your experience ❤
thank you very much! I had my whole dashboard done and if I couldn't get this to work I was SOL. SO thank you!
Dude, freaking genius! Thank you so much!
How can we change the code to personalize the color of each phase of the project ? Thank you.
Looks like you didn’t see the full video ! Follow the timestamp.
Thanks sir, your explanation helped me😊
little complex method...we can group by studentid with operation as sum and select column as subject..which will throw an error.. need to change in the script as Text.Combine([Subject], "#(cr)#(lf)")